Date: February 9, 2026 Category: Market Statistics, Real Estate News
As we turn the page on the first month of 2026, the Canadian real estate landscape is showing distinct signs of a "new normal." From the quiet streets of Vancouver to the shifting dynamics in Calgary and Toronto, January has set a tempered tone for the year. For those of us here on Vancouver Island, the story is one of nuance—where single-family homes take a breather while condos and townhomes see a surprising burst of energy.
Here is your comprehensive breakdown of the January 2026 real estate statistics and what they mean for your spring strategy.
🌲 Vancouver Island (VIREB): A Tale of Two Markets
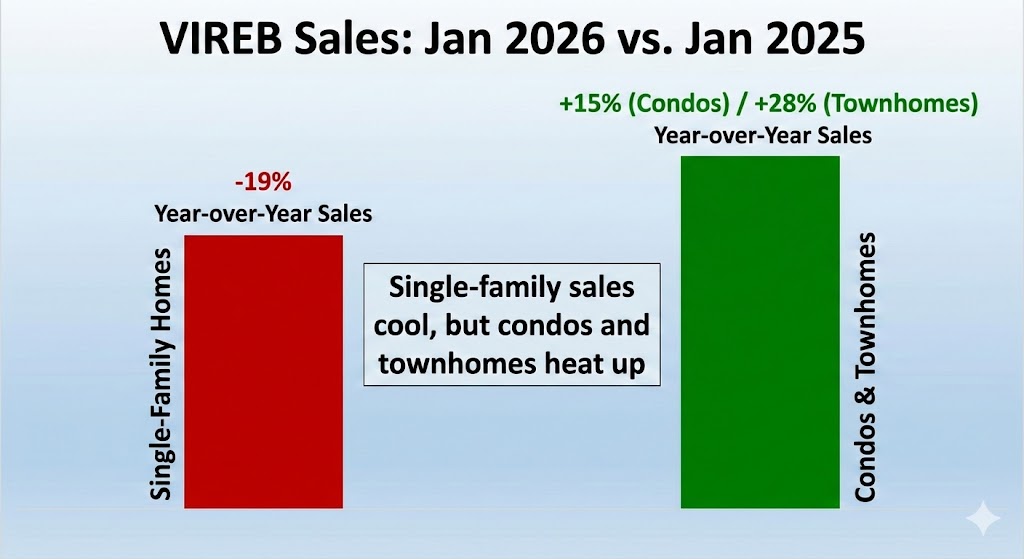
The Headline: Single-family sales cool, but condos and townhomes heat up.
The year kicked off with a mixed bag for the Vancouver Island Real Estate Board (VIREB). While the overall market felt a slight chill, specific segments outperformed expectations.
Total Sales: 388 units sold board-wide, a 10% decrease from January 2025.
Inventory: Active listings climbed to 3,157, a 6% increase year-over-year, giving buyers more breathing room.
Benchmark Prices:
Single-Family: $768,900 (Up 1% year-over-year).
Condo Apartments: $402,700 (Up 3% year-over-year).
Townhouses: $528,800 (Down 2% year-over-year).
Roman’s Take: The "slow start" for detached homes was balanced by a surge in condo and townhouse activity (up 15% and 28% respectively). If you are looking to downsize or enter the market, the multi-family sector is currently the most dynamic spot on the Island.
CAMPBELL RIVER
Unit Sales: January 2026: 17 units, -26.09% YOY Average Sale Price: $680,521, -13.85%
🏙️ Greater Vancouver (GVR): The "New Normal"
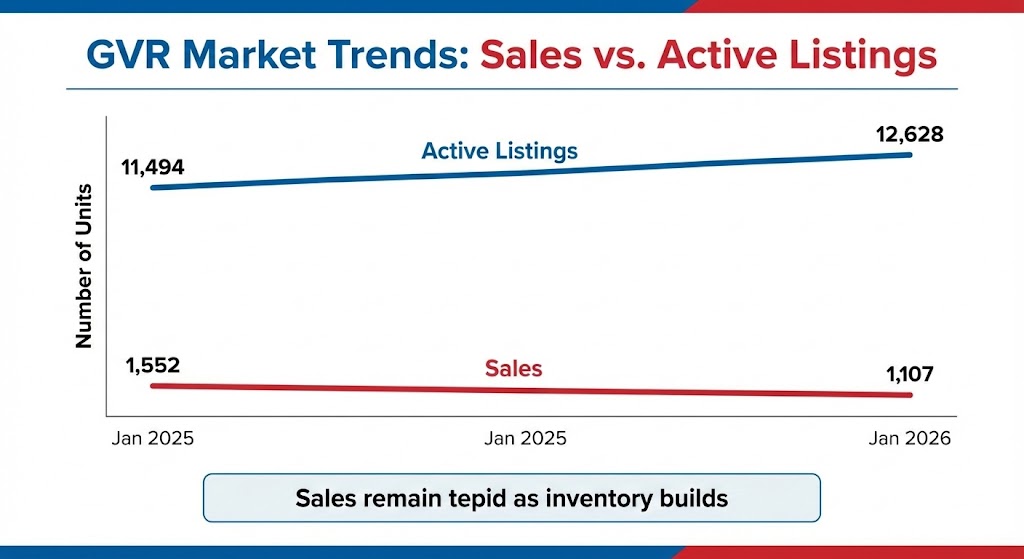
The Headline: Sales remain tepid as inventory builds.
Across the water, Greater Vancouver continues to navigate a slower pace. The "seller's market" frenzy of years past feels like a distant memory as inventory accumulates and sales dip significantly below historical averages.
Sales: 1,107 homes sold, a sharp 28.7% drop from last January and nearly 31% below the 10-year seasonal average.
Active Listings: Inventory swelled to 12,628 homes, a 9.9% increase compared to last year.
Benchmark Price: The composite benchmark price dipped to $1,101,900, down 5.7% year-over-year.
Analyst Insight: Andrew Lis from GVR notes that while these figures look alarming, they signal a market slowly evolving toward a stable, albeit quieter, norm.
The benchmark price for a detached home is $1,850,800. This represents a 7.3 per cent decrease from January 2025 and a 1.5 per cent decrease compared to December 2025.
The benchmark price of an apartment home is $704,600. This represents a 5.9 per cent decrease from January 2025 and a 0.8 per cent decrease compared to December 2025.
The benchmark price of a townhouse is $1,043,400. This represents a 5.4 per cent decrease from January 2025 and a 1.2 per cent decrease compared to December 2025.
🤠 City of Calgary (CREB): Shifting Toward Balance
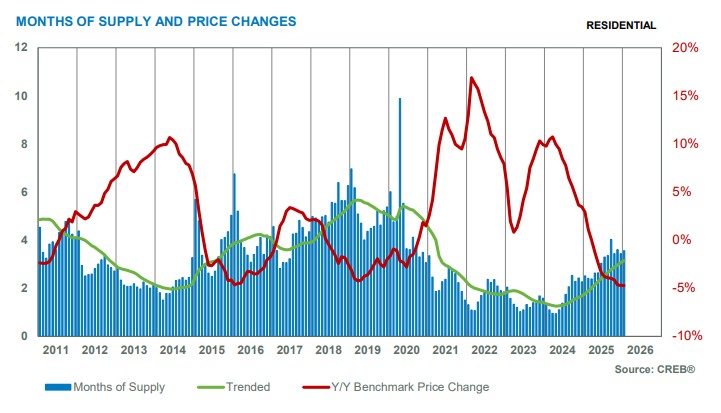
The Headline: Slow start for high-density homes.
Calgary remains a bit of an outlier compared to its coastal cousins. While sales activity has cooled from record highs, prices are still showing resilience, driven by a year of strong migration.
City of Calgary Sales: 1,234 units, down 14.8% year-over-year.
Inventory: Supply with active listings up 20.6%.
Prices: The Total Residential Benchmark Price sits at $554,400, a healthy 4.7% decrease over January 2025.
The Trend: We are seeing a shift from extreme seller advantage to more balanced conditions, with months of supply rising to 3.56.
🗼 Toronto (TRREB): Buyers Gain Leverage
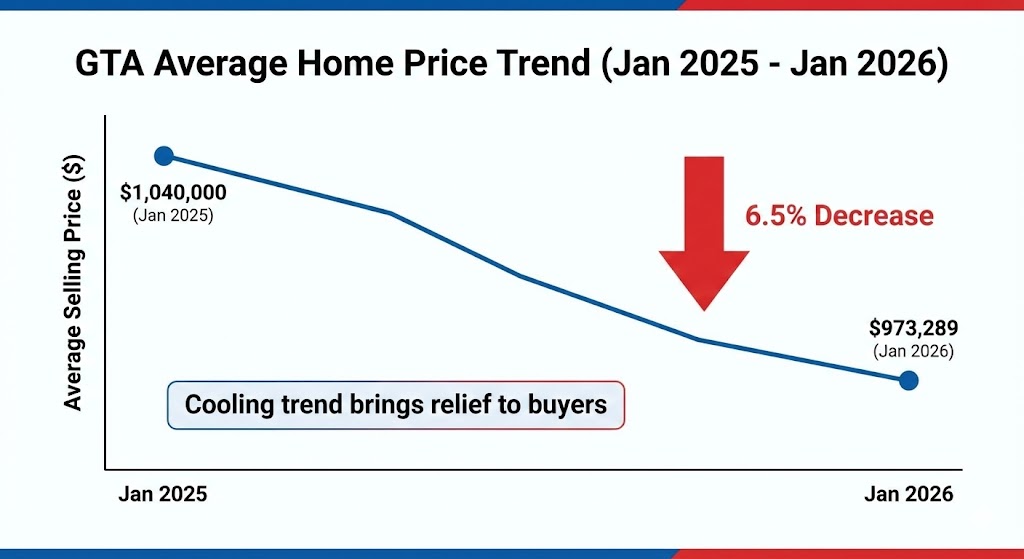
The Headline: A cooling trend brings relief to buyers.
The Greater Toronto Area (GTA) saw a pull-back in both sales and listings, suggesting that many participants decided to "wait and see" as the year began. This hesitation has put downward pressure on pricing.
Sales: 3,082 sales reported, down 19.3% year-over-year.
Average Price: The average selling price slipped to $973,289, a 6.5% decrease from Jan 2025.
Benchmark Price: The MLS® HPI Composite fell by 8%.
Market Watch: With new listings also down significantly (-13.3%), the market isn't being flooded, but the existing inventory is sitting longer, giving buyers ample time to negotiate.
🚀 The Road Ahead: Spring 2026 Strategy
For Sellers: The data is clear: pricing is paramount. In Vancouver and Toronto, buyers are price-sensitive and willing to wait. On Vancouver Island, the heat is in the strata market (condos/townhomes). If you are selling a single-family home, ensure your home is "show-ready" to compete with the rising inventory.
For Buyers: Opportunity is knocking. With inventory up in Vancouver and the Island, and prices softening in Toronto, you have more choice than you've had in years. The "frenzy" is gone, replaced by a window of negotiation power.
Ready to navigate the Spring 2026 market? Whether you're looking for that perfect Campbell River patio home or selling a property in the Comox Valley, let's chat about how these stats apply to your specific goals.
📞 Contact me today at 604-787-4594 📧 contact@romansellshomes.ca
Sources: VIREB Statistics Package Jan 2026, GVR Stats Package Jan 2026, CREB Monthly Statistics Jan 2026, TRREB Market Watch Jan 2026.